Funding trends - Donor giving - preparation document: Donor Forum/Mini Conference
Held at ActionAid – 17th November 2015
Prepared by Linda Diedericks
What does the landscape look like in SA – as far as donors are concerned?
Funding Finder – Inyathelo
There are approx. 1000 donors listed. Nearly half support educational endeavours, then second is capacity building (over 30%). The top five funded initiatives: Education, Capacity building and training, Donations, Bursaries, Partnerships/collaborations.
Provincially – western Cape – most supported province with 908 donors doing grant making to programmes in the province.
Provincial breakdown:
Funding finder can be accessed for free at Inyathelo Resource Centre
Nedbank Private Wealth – Giving Report HNWI’s – 401 structured interviews conducted in the survey – conducted between April – June 2013
Definition of HNWI – “those with either an annual income exceeding R1.5 m or investable assets (excluding their primary residence) of over R5 m.
Results of the 2012 Survey:
Where are the HNWI’s situated?
Motivation for giving:
“caring about the cause” and “wanting to make a difference”
Desire to give back to the community and religious beliefs
Nature and size of giving:
Note – focus of giving was broad and included – giving 2 religious institutions and family members
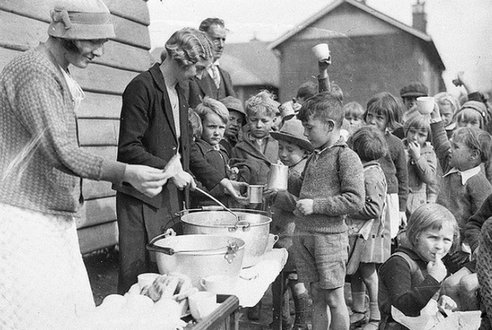
Education: Advancement – Stellenbosch University – 2013 Donor Report
Corporate social expenditure – concentrated in 3 provinces – Gauteng, KZN and W. Cape
Education, social and community development and health – receiving the largest share of CSI spending. Just over 50% of CSI funding is channelled via NPOs. CSI budgets mainly based on Net Profit After Tax (NPAT) BBBEE Codes – Require 1% expenditure of NPAT) in order to secure the full five points available. J. Harding (2014)
At SU – individual giving grew by 58% in the numbers.
2012 – R17 709 456 and in 2013 – R28 073 548
Number of donors – decreased – 2013 – 2012 – but fewer donors gave more money
In 2013 1139 donors and in 2012 – 1534
For noting: The top 21 donors (1.8%) that gave R100 k or more – were responsible for 83.3 % of total individual giving
NPOs reported that 19.8%have never received funding from individuals. There has been an increase in funding from individuals to NPOs – this is an area of opportunity for NPOs – note – raising funds from individuals can be time consuming and the research did not indicate the size of the grants.
Top 10 International donors to SU
Enabling factors and successes:
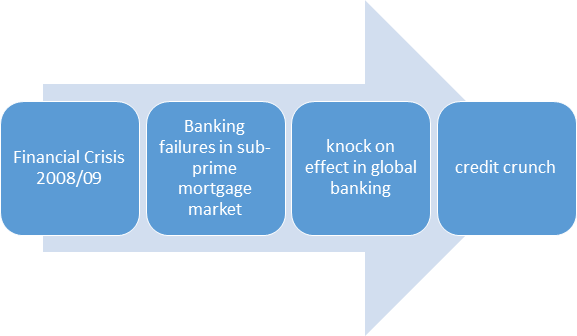
The 2008/09 financial crisis – the greatest financial crisis since the Great Depression (1929 – 1939)
Prepared by Linda Diedericks
What does the landscape look like in SA – as far as donors are concerned?
Funding Finder – Inyathelo
There are approx. 1000 donors listed. Nearly half support educational endeavours, then second is capacity building (over 30%). The top five funded initiatives: Education, Capacity building and training, Donations, Bursaries, Partnerships/collaborations.
Provincially – western Cape – most supported province with 908 donors doing grant making to programmes in the province.
Provincial breakdown:
- Gauteng – 980
- Eastern Cape – 849
- KZN – 847
- Free State – 825
- Limpopo – 771
- Mpumalanga – 754
- North West – 751
- Northern Cape (least) – 690
Funding finder can be accessed for free at Inyathelo Resource Centre
Nedbank Private Wealth – Giving Report HNWI’s – 401 structured interviews conducted in the survey – conducted between April – June 2013
Definition of HNWI – “those with either an annual income exceeding R1.5 m or investable assets (excluding their primary residence) of over R5 m.
Results of the 2012 Survey:
Where are the HNWI’s situated?
- in Gauteng with 53% in Gauteng area
- 16% in KZN and WC
- 91% of respondents gave money, time, goods to social causes in 2012 – decrease from 2011
- Those with higher net worth give more
- Reason for not giving: - a negative experience
- An increasing proportion of non-givers cited ideological grounds as reasons for not giving
- Of those donor who did not give in 2012, nearly had never given before and do not plan to in the future
- Not being asked
- Over had never given but plan to do so in future – Opportunity!
Motivation for giving:
“caring about the cause” and “wanting to make a difference”
Desire to give back to the community and religious beliefs
Nature and size of giving:
- Cash donations – less than R25 000 – the proportion of people giving smaller donations has increased
- of respondents gave goods, products/services in 2012
- Non cash giving smaller than cash giving, 78% of non-cash giving – donating items with a value of less than R25 000
- Since 2010 there has been a decline in the non-cash giving area
- Most common form of giving other than cash – volunteering of time to NPOs
- Based on the giving characteristics of survey sample – estimated that SA HNWI’s donated roughly R8 bn in cash, R5.1 bn in goods and services, 7.9 million of their hours in time (2012)
- Size of HNW market – approx. 300 000 individuals – this means that approx. 272 000 of HNWIs in the country made cash/non cash donations or volunteered in 2012
Note – focus of giving was broad and included – giving 2 religious institutions and family members
Education: Advancement – Stellenbosch University – 2013 Donor Report
- The total audited donations for 2013 – R196 453 (increased by 16%) from 2012
- Breakdown of donors:
- Corporates, Foundations and trusts – gave 51% - R99.39 m
- International donors – 24% - R47.67 m
- Individuals – 14% - R28 m
- Bequests – 11 % - R21.3 m
- Claude Leon Foundation
- Discovery Foundation
- Eskom Development Foundation
- Het Jan Marais Nationale Fonds
- Minerals Education Trust Fund
- Murray and Roberts Ltd
- National Lotteries Board
- Proton Software Consultants
- Remgro Management Services Ltd
- SAS Institute (Pty) Ltd
Corporate social expenditure – concentrated in 3 provinces – Gauteng, KZN and W. Cape
Education, social and community development and health – receiving the largest share of CSI spending. Just over 50% of CSI funding is channelled via NPOs. CSI budgets mainly based on Net Profit After Tax (NPAT) BBBEE Codes – Require 1% expenditure of NPAT) in order to secure the full five points available. J. Harding (2014)
- From the analysis of financial statements sent in by NPOs – only 5% of income came from local corporates
At SU – individual giving grew by 58% in the numbers.
2012 – R17 709 456 and in 2013 – R28 073 548
Number of donors – decreased – 2013 – 2012 – but fewer donors gave more money
In 2013 1139 donors and in 2012 – 1534
For noting: The top 21 donors (1.8%) that gave R100 k or more – were responsible for 83.3 % of total individual giving
NPOs reported that 19.8%have never received funding from individuals. There has been an increase in funding from individuals to NPOs – this is an area of opportunity for NPOs – note – raising funds from individuals can be time consuming and the research did not indicate the size of the grants.
Top 10 International donors to SU
- Aims Next Eintstein International Foundation
- Carnegie Corporation of New York
- Confuscious Institutes Headquarters Beijing
- Deutsche Akademiese Austenschdienst
- Embassy of Belgium
- International Development Resource Centre
- Michael and Susan Dell Foundation
- Mondi Services Uk Ltd
- Moshal Scholarship Programme
- Wallenburg Foundation
Enabling factors and successes:
- A fundraising strategy and plan in place with targeted goals, linked to broader strategic goals
- Have a communication strategy – online social media platform, twitter, facebook, Linkedin
- A donor publication is sent to donors annually, featuring donors and students that benefit
- A donor recognition event is held to thank donors, and part of the stewardship plan
- Diverse funding base – International, local foundations, trust and corporates, individuals (alumni)
- A telethon – had postgraduate students call alumni in a specific age group (45 – 55) – data mining – with motivation for specific group
- In 2013 – they had a 336% increase in targeted appeals to alumni
- My school card – joined as one of the schools of choice – ( Woolworths raised R5.3 m in September for schools and charity) – for students, alumni, residences and societies – a percentage of the total sales will be paid over to SU annually
The 2008/09 financial crisis – the greatest financial crisis since the Great Depression (1929 – 1939)
- Pre-1994 fundes were funding pro-democracy – NPOs
- Donors were more flexible ito planning and reporting requirements – argument that this possibly contributed to inefficiency and ineffectiveness of NPOs delivering services
- Grants were given more easily, fundraising was easier and required less skill
- Evidence in literature – that NPOs are struggling with fundraising for their organisations
- This, coupled with the number (increasing) of organisations being registered – increased competition for limited resources
- According to NGO Pulse – 2013 – there were 85 000 registered NPOs
External and internal Factors affect sustainability of NPOs
- Current situation in country – economy, political situation, attitudes of foreign governments, local and international corporates and international and local faith based organisations
- Internal factors that affect sustainability of NPOs – governance, fundraising strategies and methods, marketing and leadership and management and building partnerships
- Government agencies set up by to contribute to sustainability of sector, such as National Development Agency, National Lotteries Distribution Fund – criticised by the sector and not able to cope with high demand made by NPOs on their funds
- Of the respondents – 45.5% had never received funding from Lotteries
- There is dissatisfaction with the way in which grants are disbursed – related to uncertainty of funding – biggest cause of unhappiness – followed by lengthy process.
- At one stage the NLDF distributed less than 50% of available funds – ticket sales decreased slightly from R4.9 to R4.7 bn in 11/12 and 12/13 BUT there was an increase in grant allocations – R1.4 b to R1.9 b - possible reason – due to highly publicised surplus
- These factors together with poor administration – resulted in perception that they are not making the contribution to NPOs that they intended to make
- Foreign funding appears to have been reduced – US and EU are SAs biggest donor partners – 20.6% respectively to the Overseas Development Aid (ODA) to SA between 2005-07 – this is according to the literature – the decrease – however the research indicates that funding from foreign foundations has increased by 28.7%. These foundations are mainly organisations that have been endowed by individuals and families such as the Ford Foundation. Foundations not limited by foreign policy and can determine funding priorities.
- The analysis of the NPOs financial statements – 63% of funding still sourced from international funders (the analysis limited to only half the respondents who submitted AFS).
- Reasons for foreign funding (reduction) – changes to bi-lateral agreements between SA govt and other governments – from financial aid to trade relationships
- With high levels of poverty in countries such as Mozambique and Malawi – foreign governments re- focusing financial contributions, SA viewed as middle income country
- Government funding to NPOs – inconsistent – more than half of the respondents did not receive funds from National, provincial and local government.
- Common reason for government funding not being accessed – NPOs are not proactive enough about finding out about government funding and
- Government departments not advertising the availability of these funds well enough to NPOs
- Donors setting the agenda – this is an increasing trend – varies from donors designing programmes, and finding organisation to fund, to donors actually implementing programmes and possibly using NPOs as service providers
- According to the Funding Practice Alliance (FPA) obsession with impact and indicators, driven by international aid agencies – filtrated into foundations and the corporate sector – the focus on quantitative indicators contradicts with the long term nature of social change
Advancement vs Fundraising vs Proposal fundraising
- Proposals are more successful when there is a relationship with the donor and the donor has invested intellectually in the organisation
- A proposal is the tool for convincing the donor in writing that the problem is of significant magnitude – there is a plan and the organisation has the creativity and innovation to address the problem
- Proposals take time to write and are not the overnight solution of a funding need
- Donors give to people – people give to people
Donors want to feel involved in the organisation they give money to and it is the advancement or fundraiser responsibility to get them involved
